
A hidden tax on the global economy
Note
In today’s global economy, where information crosses continents in fractions of a second, the financial infrastructure that underpins it paradoxically remains stuck in the last century. We, the experts at DARCA (Decentralized Autonomous Research & Crypto Agency), conducted a large-scale and in-depth study to quantitatively assess and analyze the systemic problems faced by both individuals and legal entities when using traditional banking services in the European Union and the United States. Our analysis unequivocally confirms: slow and expensive transfers, exacerbated by hidden fees and opaque pricing, are not merely an inconvenience, but a systemic drag on economic growth and prosperity.
This report represents the most comprehensive collection of facts, statistical data, and impact analysis related to these issues. We examined dozens of authoritative sources - ranging from reports by central banks and government agencies to research by leading consulting firms and academic papers. The goal of this study is not only to state the existence of the problems, but to demonstrate the colossal scale of missed opportunities and financial losses, as well as to identify the massive, unmet demand for fairer, faster, and more efficient financial solutions.
Warning
The results of our analysis are shocking. Every year, tens of billions of euros and dollars are irreversibly lost deep within the banking system in the form of hidden exchange rate markups and unjustifiably high fees. Millions of companies, especially in the small and medium-sized business (SMB) sector, suffer from cash flow gaps caused by multi-day payment delays, which directly lead to reduced investment, slower growth, and even bankruptcies.
In this report, we will explore each aspect of these issues in detail, supporting our conclusions with concrete figures and references to primary sources. We will demonstrate that solving these issues is not merely about creating yet another financial product, but a key to unlocking enormous economic potential. For DARCA, this is not just research; it is confirmation of our mission and a substantiation of the vast market opportunity that opens up for those ready to offer the world a new, more advanced financial paradigm.
Table of contents
- Chapter 1: The problem of slow bank transfers - the cost of waiting
- Chapter 2: The high cost of inefficiency: fees, spreads, and hidden charges
- Chapter 3: Market response: a crisis of trust and a mass shift to alternatives
- Chapter 4: A strategic opportunity for DARCA
- Conclusion: Time for a revolution
- Sources and references

The problem of slow bank transfers - the cost of waiting
Speed is the currency of the modern economy. However, in the world of bank transfers, time seems to have stood still. This chapter is dedicated to a detailed analysis of delays, their causes, scale, and destructive consequences.
1.1. The mechanics of delays: how money actually moves
Info
To understand why transfers are delayed, it’s important to look at the outdated infrastructure that traditional banks still use.
-
SWIFT (Society for Worldwide Interbank Financial Telecommunication): This is the primary standard for international transfers. It is important to understand that SWIFT is not a payment system, but a messaging system. The actual transfer process requires the involvement of multiple correspondent banks, where each link adds time and cost.
- Average time: In practice, transfers often take 2-5 business days, and sometimes up to 10 days.
- SWIFT GPI (Global Payments Innovation): Improved the situation, but is not a universal standard and does not fully solve the problem.
-
SEPA (Single Euro Payments Area): In Europe, a standard transfer (SCT) takes up to one business day. The instant system SCT Inst (up to 10 seconds) is being rolled out extremely slowly.
-
ACH (Automated Clearing House) in the United States: A system for domestic transfers that processes payments in batches on business days. Standard settlement time - 1-3 business days.
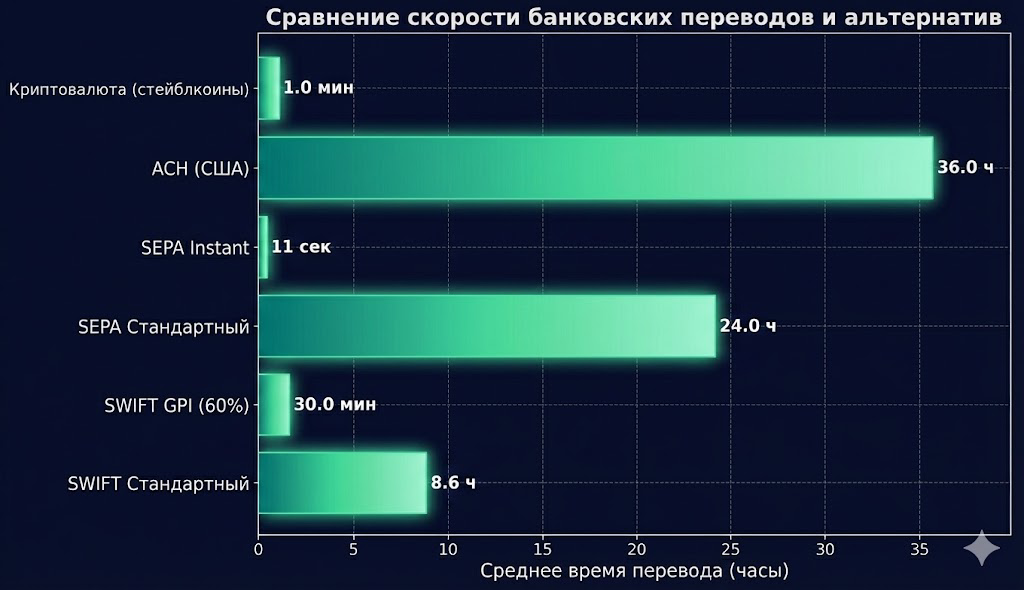
Fig. 1. Comparison of average processing times for different types of transfers. Sources: SWIFT, ECB, CFPB, 2023-2025.
1.2. Statistical reality: how slow are transfers really?
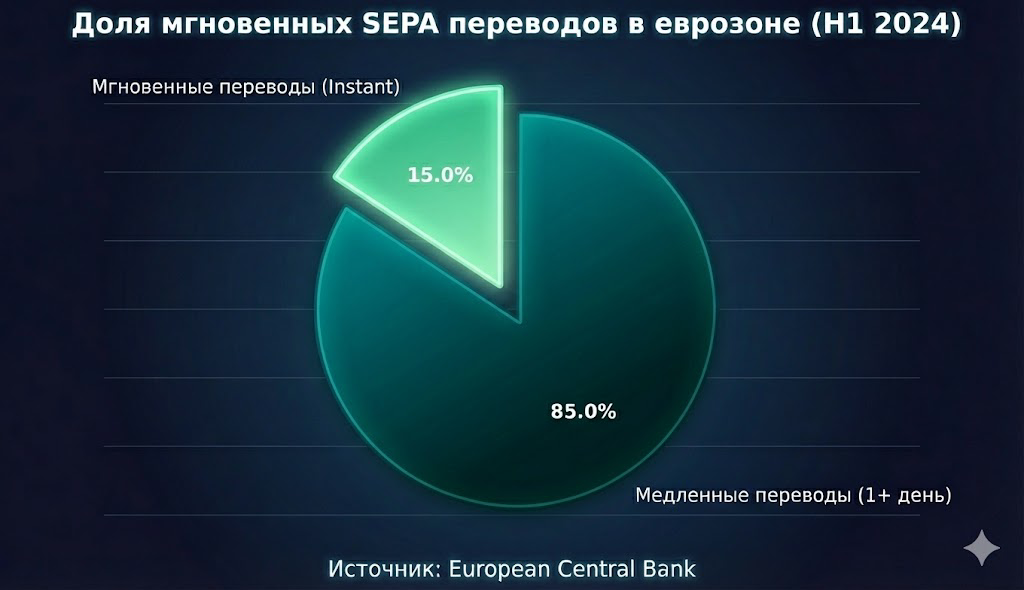
In the European Union, according to ECB data, the share of instant transfers (SEPA Instant) accounted for only 15% of the total volume in the first half of 2024. This means that 85% of all transfers in the eurozone are still processed slowly. The situation is worsened by banks’ lack of readiness: as of early 2025, only one third of European banks were prepared for the new EU Regulation on instant payments.
 *
*
Fig. 2. The vast majority of transfers in the EU are still not instant. Source: European Central Bank, 2025.
Warning
In the business sector, the situation is catastrophic. The EU Payment Observatory report for 2024 shows:
- Average B2B payment time (business-to-business) in the EU: 61.8 days.
- Average G2B payment time (government-to-business): 69 days, which blatantly violates the legal limit of 30 days.
In 2023, 47% of all companies in the EU faced problems due to late payments. In the United States, around 80% of small businesses experience similar issues.
1.3. The human factor: complaints and frustration
Behind the dry numbers are millions of real people. The level of dissatisfaction has reached a critical point:
- United Kingdom: A 54% year-over-year increase in complaints about financial services, the highest level in 6 years.
- Germany: Complaints about banks have been rising for the fourth consecutive year (+20% in 2022).
- United States: More than 178,000 complaints over three years related to accounts and transfers.
Surveys confirm: 70% of consumers expect instant access to funds, but reality often fails to meet these expectations.
1.4. Consequences for business: cash flow gaps, bankruptcies, and missed opportunities
Danger
An existential threat to SMBs.
- One in four bankruptcies (25%) in Europe occurs because invoices are not paid on time.
- In the United Kingdom, small businesses spend £4.4 billion per year on collecting overdue payments.
- £112 billion is locked in overdue invoices of UK small businesses.
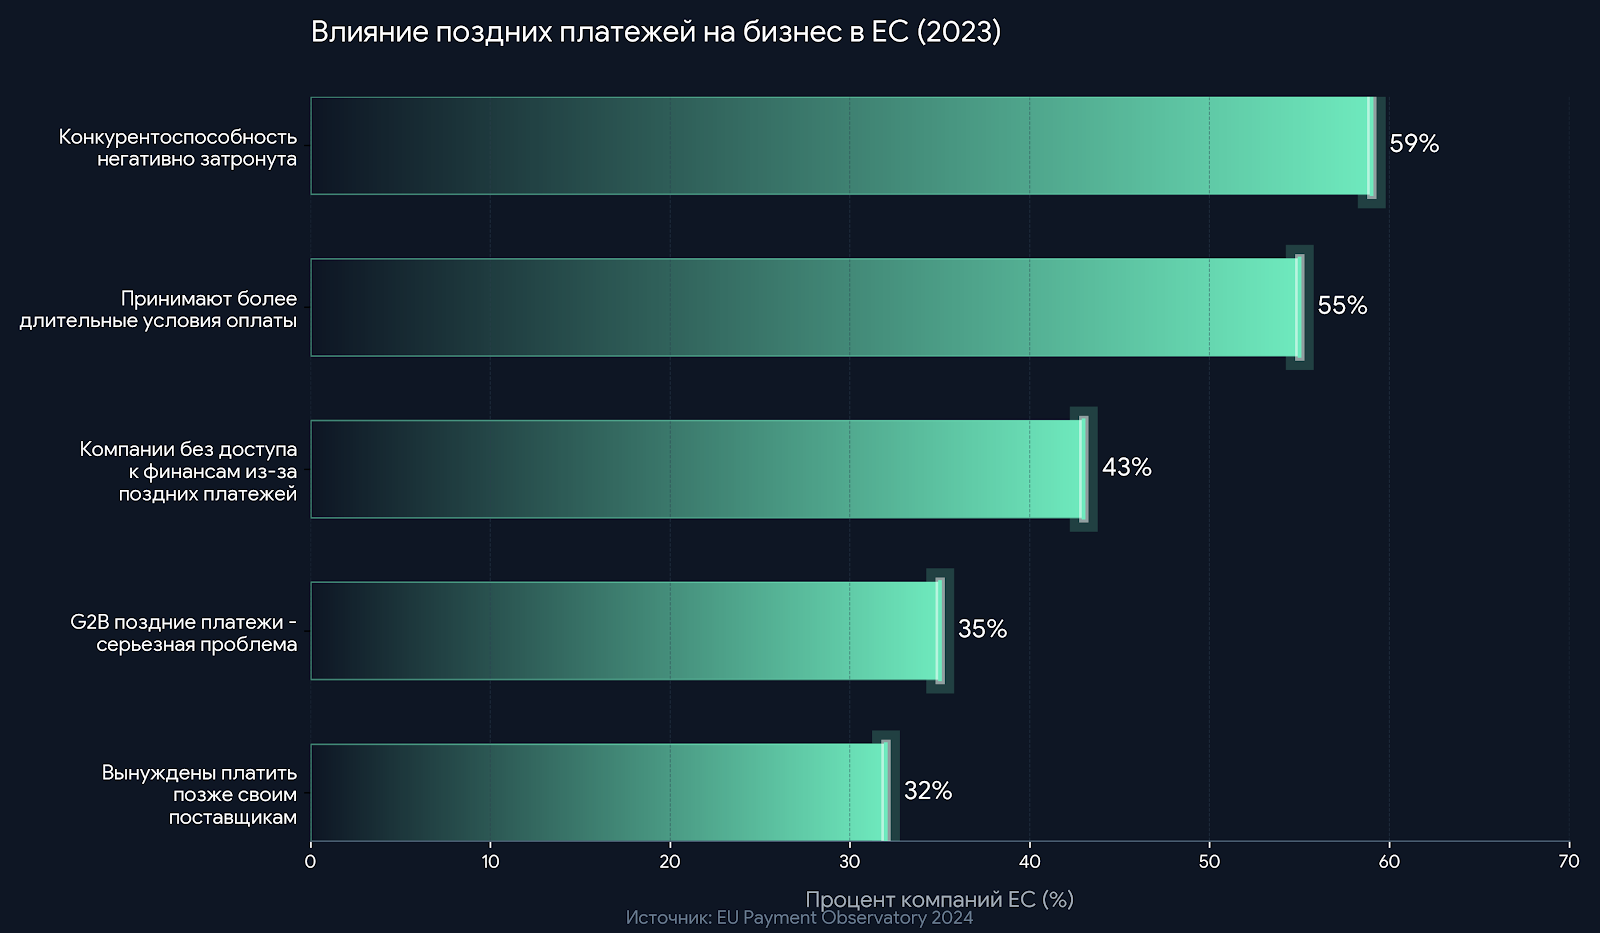
- Operational issues: 32% of European companies are forced to delay payments to their own suppliers due to late incoming payments, creating a “domino effect”.
- Access to financing: 61% of companies in the EU reported a deterioration in banks’ willingness to provide them with credit.
- Loss of competitiveness: 59% of companies in the EU state that their competitiveness suffers.
- Barriers to expansion: 50% of SMB owners acknowledge the complexity of international settlements as a serious obstacle.
 *
*
Fig. 4. Late payments create a cascade of negative consequences for businesses. Source: EU Payment Observatory, 2024.

The high cost of inefficiency: fees, spreads, and hidden charges
If slowness is a tax on time, then the cost of transfers is a direct and unfair tax on money.
2.1. Explicit costs: transfer and service fees
The cost of a single outgoing international transfer at leading US banks averages around $49.
| Bank (USA) | Incoming transfer fee | Outgoing transfer fee |
|---|---|---|
| Bank of America | $16 | $45 |
| Chase | $15 | 40 online) |
| Wells Fargo | $16 | $40 |
| Citibank | $15 | 35 online) |
| U.S. Bank | $25 | $50 |
| Среднее значение | ~$16 | ~$49 |
Table 1. Comparison of international transfer fees at major US banks (September 2023). Source: MyBankTracker. |
2.2. Hidden robbery: exchange rate markup (FX spread)
Info
The most insidious source of bank revenue is the implicit fee hidden in the exchange rate. Banks apply their own marked-up rate (spread), which can reach from 1% to 5% of the transfer amount.
Example: When transferring €10,000 into dollars with a 3% bank markup, the client quietly loses €300 solely due to the exchange rate difference.
The study showed that 88% of European banks were not fully transparent about their exchange rates.
2.3. The scale of the damage: a quantitative assessment of financial losses
- In the EU: €30 billion - this is how much consumers and businesses lost in 2023 on hidden fees alone.
- In the United States: $82 billion per year - the total amount of various banking charges.
- Global corporations: $120 billion per year - this is how much companies lose on cross-border payment fees.
According to the World Bank, the average cost of sending $200 through a bank is 11.97%, which is almost 4 times higher than the UN Sustainable Development Goal target (3%).
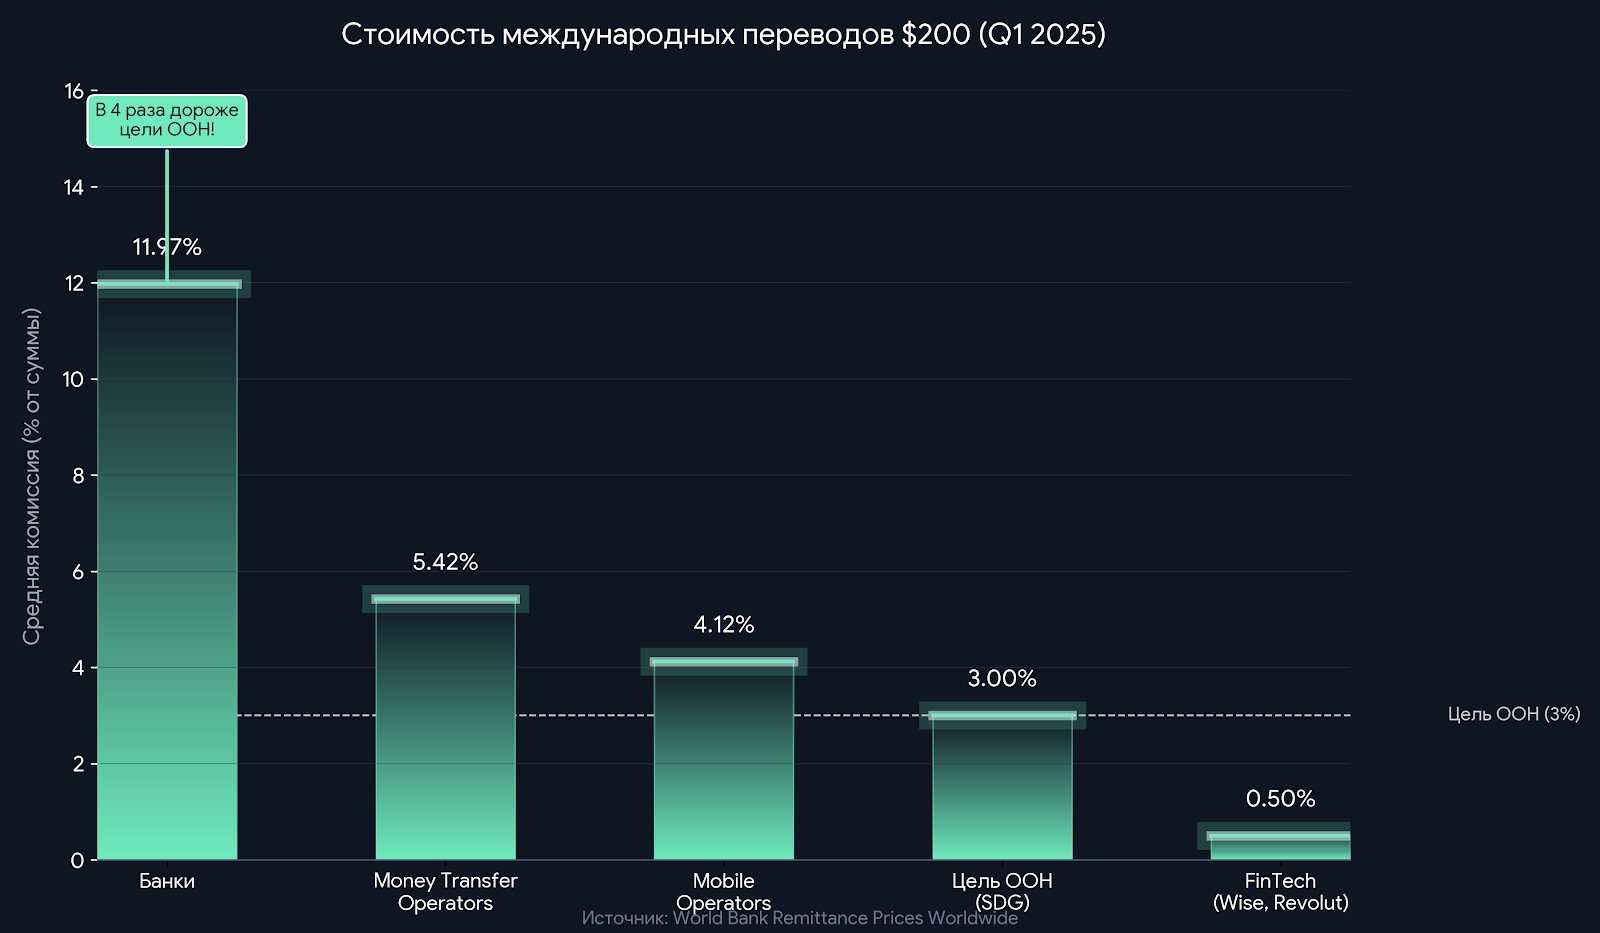
Fig. 7. Banks are the most expensive way to send money. Source: World Bank, 2025.
2.4. Consequences for business: barriers to growth
- 55% of European SMBs cite unfair pricing as their primary problem.
- Small and medium-sized enterprises in the United States lose $34.8 billion per year due to hidden fees. This amount would be enough to create 535,000 new jobs.
- 43% of companies could increase their profits by more than 10% if payment inefficiencies were eliminated.

Market response: a crisis of trust and a mass shift to alternatives
3.1. A crisis of trust: when a bank stops being a partner
- 66% of clients believe that rising banking fees undermine their trust in their bank.
- 70% of consumers and SMBs state that they would never return to a provider that deceived them with hidden fees.
3.2. The great exodus: willingness to switch banks reaches a historic high
- 33% of consumers worldwide are ready to switch their primary financial provider due to high fees.
- Demographic breakdown: Dissatisfaction is especially pronounced among younger generations: 58% of millennials and 57% of Generation Z are ready to switch banks.
- Business segment: 75% of European SMBs are considering diversifying their banking partners.
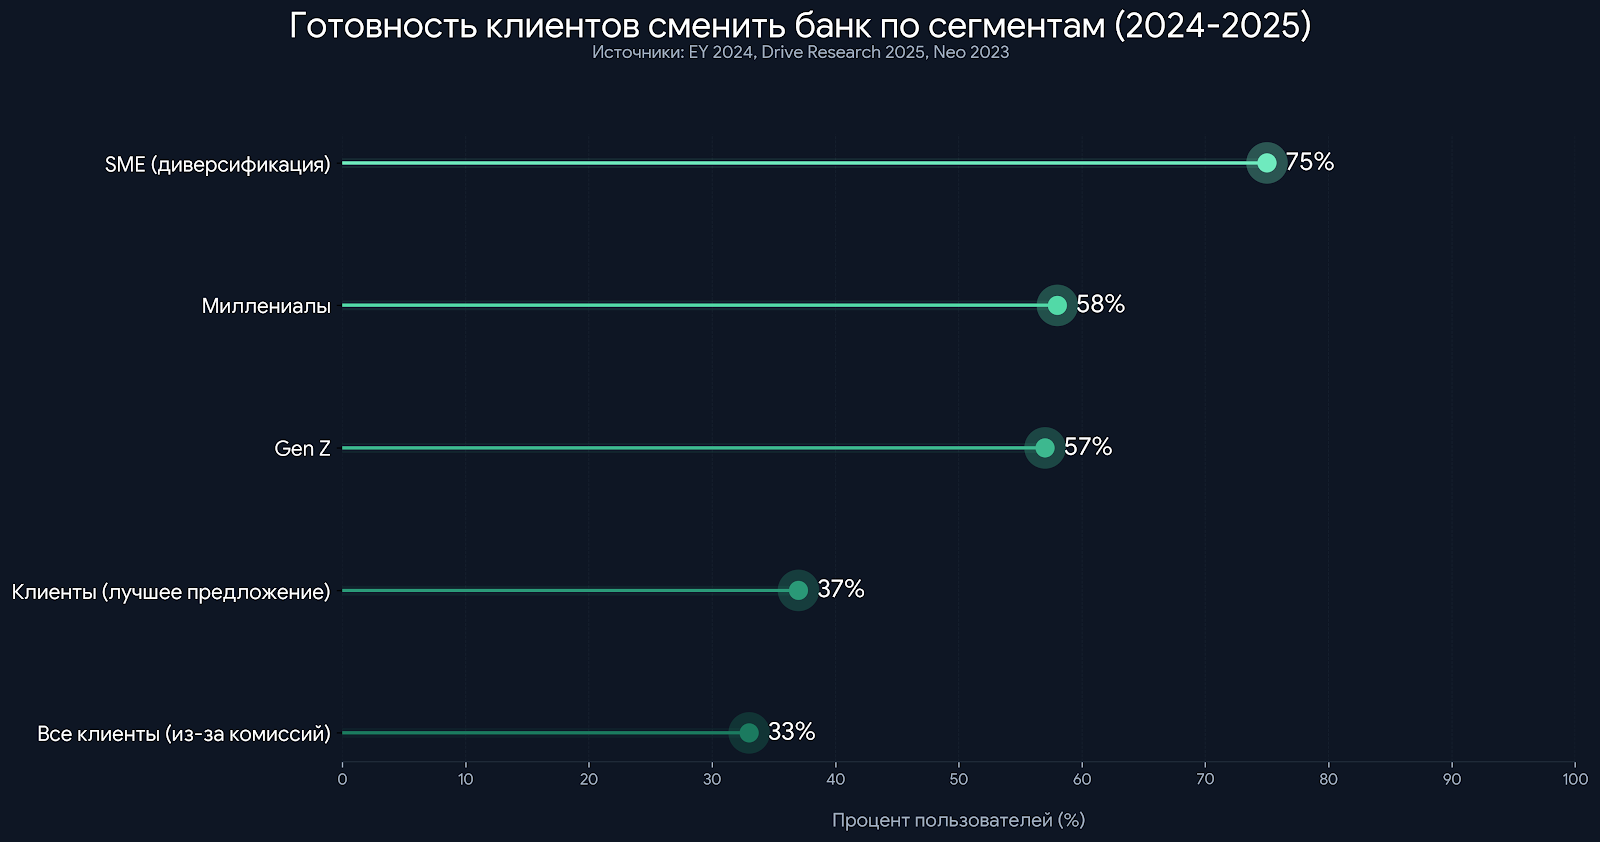
Fig. 9. The vast majority of young clients and businesses are actively seeking alternatives. Sources: EY, Drive Research, Neo.
3.3. Explosive growth of FinTech: a response to unmet demand
Note
Nature abhors a vacuum, and the market does too. Against the backdrop of dissatisfaction with traditional banks, there has been explosive growth in FinTech companies.
-
Scale of adoption:
- 64% of consumers worldwide already use FinTech services.
- 75% of clients use FinTech specifically for payments and transfers.
- 65% of European SMBs already use non-bank payment solutions.
-
The stablecoin market: The capitalization of this segment, which offers instant and ultra-low-cost global transfers, has reached 2 trillion by 2028.

A strategic opportunity for DARCA
The analysis conducted clearly indicates a deep systemic crisis that creates a unique “window of opportunity” for innovative platforms.
4.1. A direct response to market pain
DARCA’s business model is a direct response to the key problems identified during the research.
| Problem | DARCA solution |
|---|---|
| Slow transfers (days) | Instant transactions (seconds) |
| High and hidden fees | Zero or minimal fees, full transparency |
| Opaque FX spreads | P2P exchange at market rates |
| Limited access for SMBs | Corporate solutions tailored for business |
Table 2. Alignment of DARCA offerings with key market problems. |
4.2. Quantitative assessment of the market opportunity
- Potential market: Tens of millions of clients and millions of companies are actively seeking an alternative.
- Volume of “unlocked” funds: This refers to tens of billions that clients can save. In the EU alone, this is €30 billion per year in hidden fees, and in the United States - $82 billion in banking charges. DARCA can position itself as a tool to return this money to people and businesses.
4.3. Strategic positioning
Info
DARCA should position itself not simply as “another FinTech”, but as a next-generation financial platform. Key messages:
- Fairness: “Get your money back. We do not charge hidden fees”.
- Speed: “Your money moves at the speed of information. Instantly. Globally”.
- Opportunities for business: “Stop losing money on transfers. Start investing in growth”.

Time for a revolution
Our research irrefutably proves: the traditional banking system is a giant “hidden tax” on the global economy that restrains growth, undermines prosperity, and destroys trust.
The scale of the catastrophe in numbers:
- 85% of transfers in the eurozone are still slow.
- Average B2B payment time in the EU - 62 days.
- Bank transfer fees are 4 times higher than the UN target.
- €30 billion per year - losses of Europeans due to hidden fees.
- One in four bankruptcies in the EU is linked to late payments.
- More than half of young clients and 75% of SMBs are ready to switch banks,
These problems have created a massive vacuum in the market. For DARCA, this is confirmation of our mission. Our platform offers exactly what the market is waiting for: instant, global, and virtually free transactions.
The market is ready for a revolution. Clients are disappointed and ready to move. DARCA is ready to become that platform.
Sources and references
SWIFT. (2023). SWIFT Annual Review 2023. SWIFT. (2024, October). SWIFT GPI Observer Analytics. Consumer Financial Protection Bureau (CFPB). (2025). Report on ACH Payments. European Central Bank. (2025, January 30). Payments statistics for the first half of 2024. EY. (2025, January 6). EU instant payments: Challenges and compliance by 2025. European Commission, EISMEA. (2024, December). EU Payment Observatory Annual Report 2024. European Commission. (2024, December). EU Payment Observatory, Summary of Findings, Annual Report 2024. Federal Reserve Banks. (2024, December 5). 2024 Report on Payments: Findings from the 2023 Small Business Credit Survey. Financial Ombudsman Service UK. (2025, October 29). Half-yearly complaints data H1 2025. BaFin (Federal Financial Supervisory Authority). (2023). Annual Report 2022. CFPB. (2025). Consumer Complaint Database Analysis 2022-2025. PYMNTS. (2025, October). Real-Time Payments Tracker. Kaya, O. (2024). The impact of late payments on SMEs’ access to finance. Economic Modelling, 141. Federation of Small Businesses (FSB). (2023). Late Payment Report. Sage & CEBR. (2025, May 14). Addressing late payments could unlock £112 Billion in cashflow for small businesses. U.S. Chamber of Commerce. (2024). SME International Trade Report. MyBankTracker. (2023, September). Wire Transfer Fees Comparison. Deutsche Bank. (2025). Pricing and Services Overview. DutchNews.nl. (2024). ING raises fees for basic payment accounts. Wise. (2024). Transparency Report on CBPR2 Compliance. Politico. (2024). The EU has a €30 billion hidden fees problem. Wise & CEBR. (2024). The Hidden Growth Tax on US Small Businesses. EY. (2024). Global Banking Consumer Study. Financial Health Network. (2024). Overdraft & NSF Fees Report. FF News. (2024). Cross-border payments in numbers: Global corporations lost $120 billion. The World Bank. (2025, Q1). Remittance Prices Worldwide. Neo & Treasury Management International. (2023, July 27). Growing pains: the escalating cross-border payment challenges for SMEs. Flywire. (2024). How much does it cost you to get paid?. PwC. (2024). Trust in Financial Services Report. Drive Research. (2025). Banking Trends & Statistics. J.D. Power. (2024). U.S. Retail Banking Satisfaction Study. DemandSage. (2025, August). Fintech Statistics 2025. McKinsey & Company. (2025). The Future of Payments.
Start agentCreate